ODP was created to promote openness, transparency, and accountability of state government by providing high-value government data.
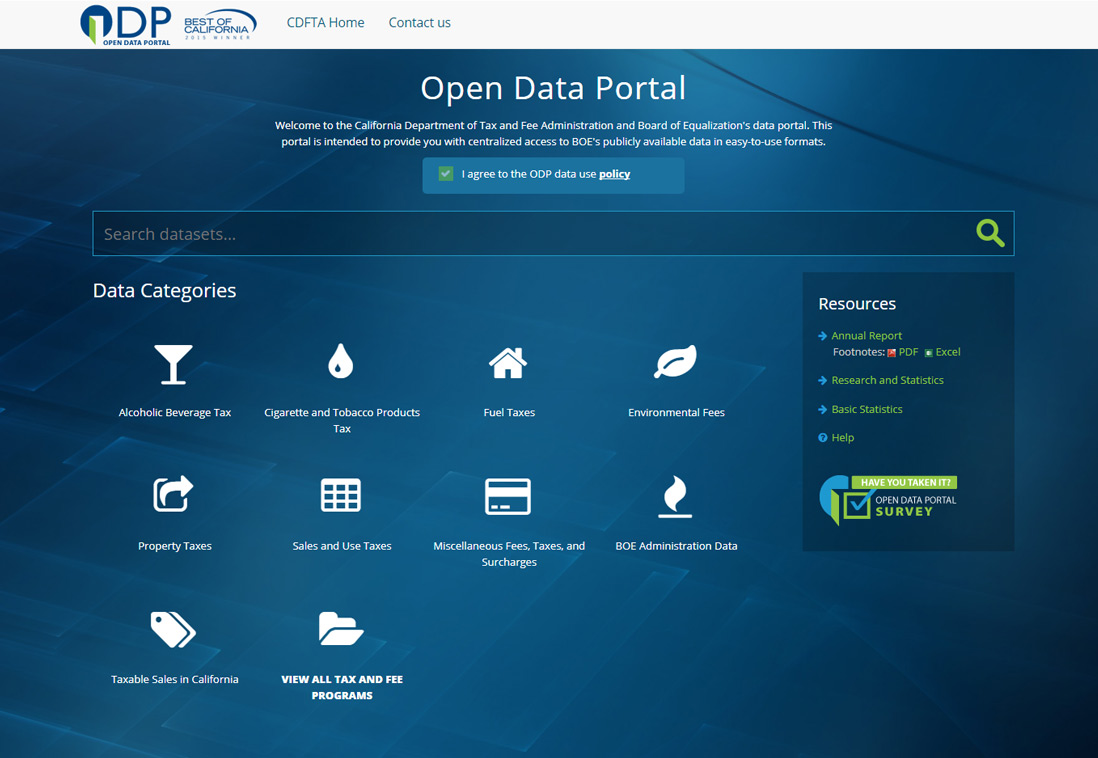
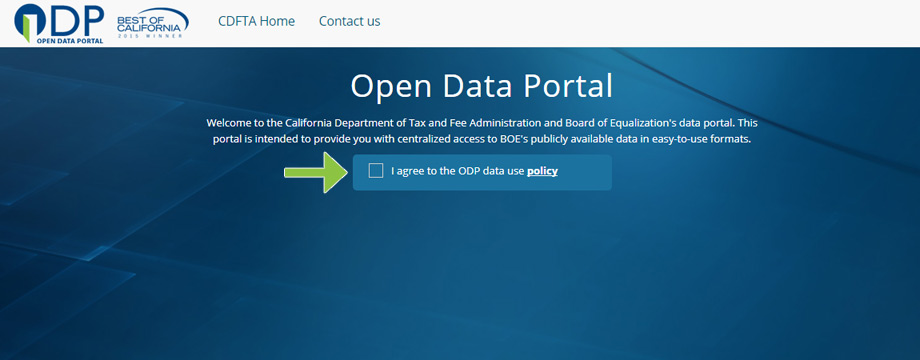
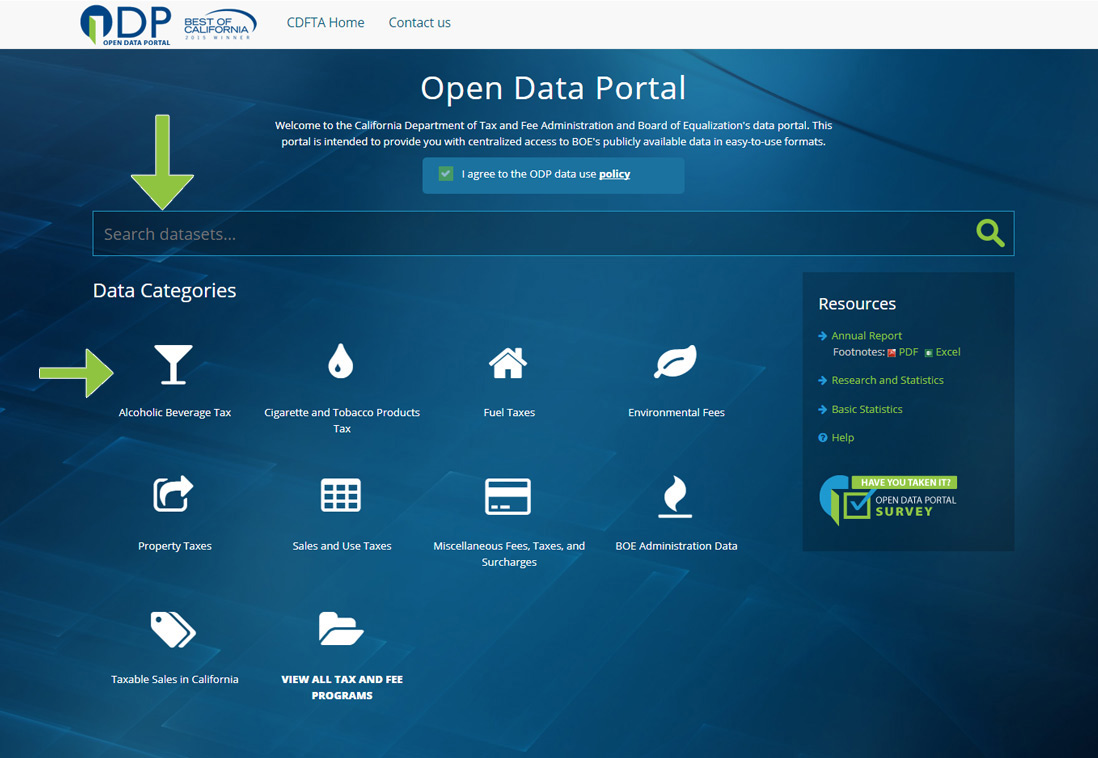
To access the Data Portal, the user must click on the checkbox to agree to the BOE open data use policy (terms of use can be found by clicking the link labeled "policy"). This activates the categories listed below the agreement checkbox.
Explains ODP and provides links to resources as well as images of default charts.
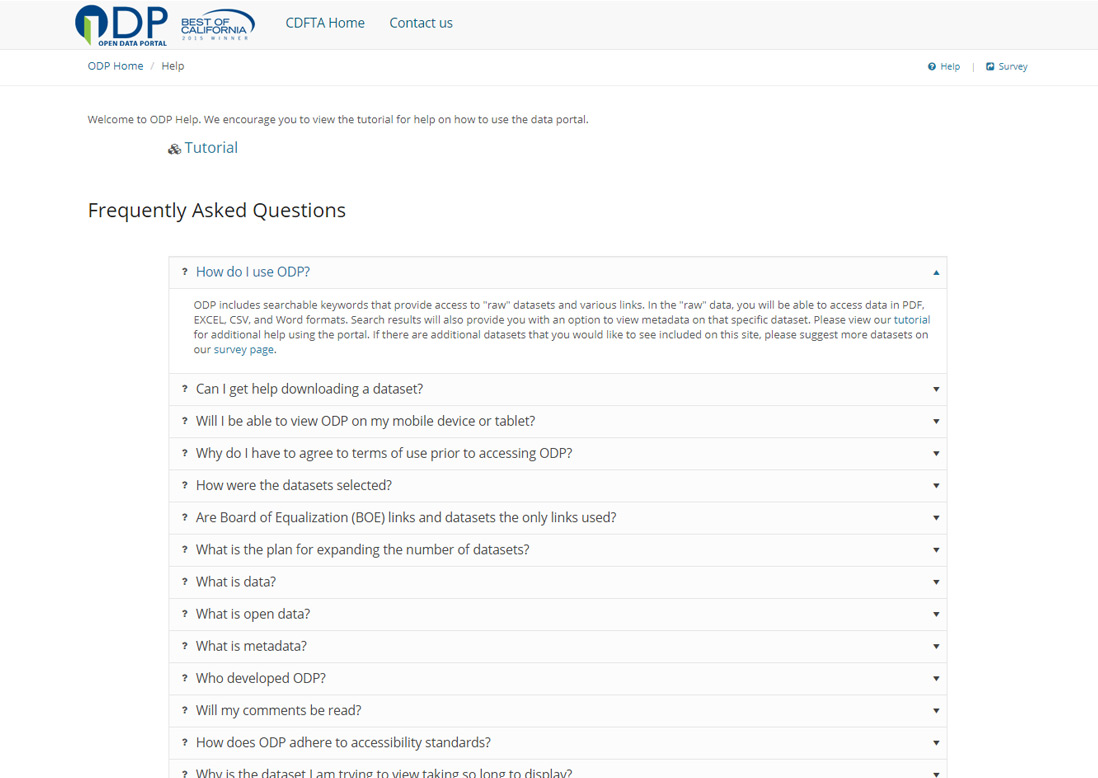
A link to the Help Page is available on each page. Once the Help link is clicked the user has the ability to view the Tutorial or read the Frequently Asked Questions (FAQs).
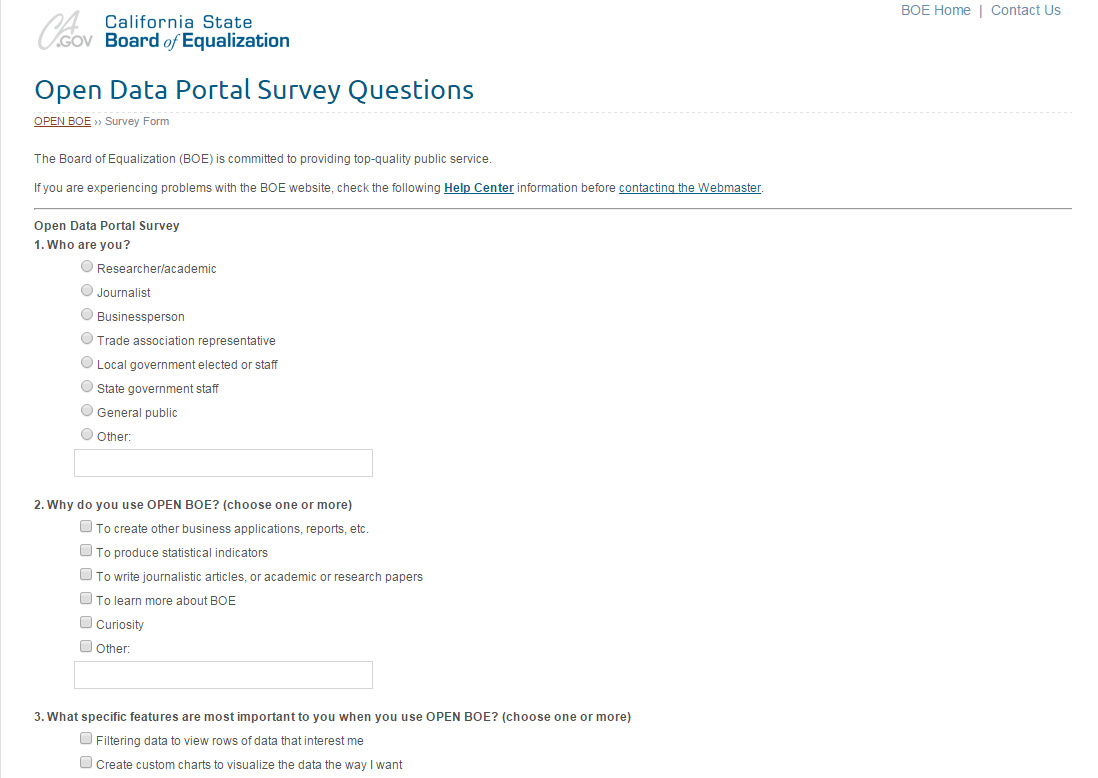
A link to the Survey Form is available on each page. The Survey Form allows the user to rate their experience of the Data Portal.
To access ODP, the user must click on the checkbox to agree to the BOE Data use policy (terms of use can be found by clicking policy). This activates the categories listed below the agreement checkbox.
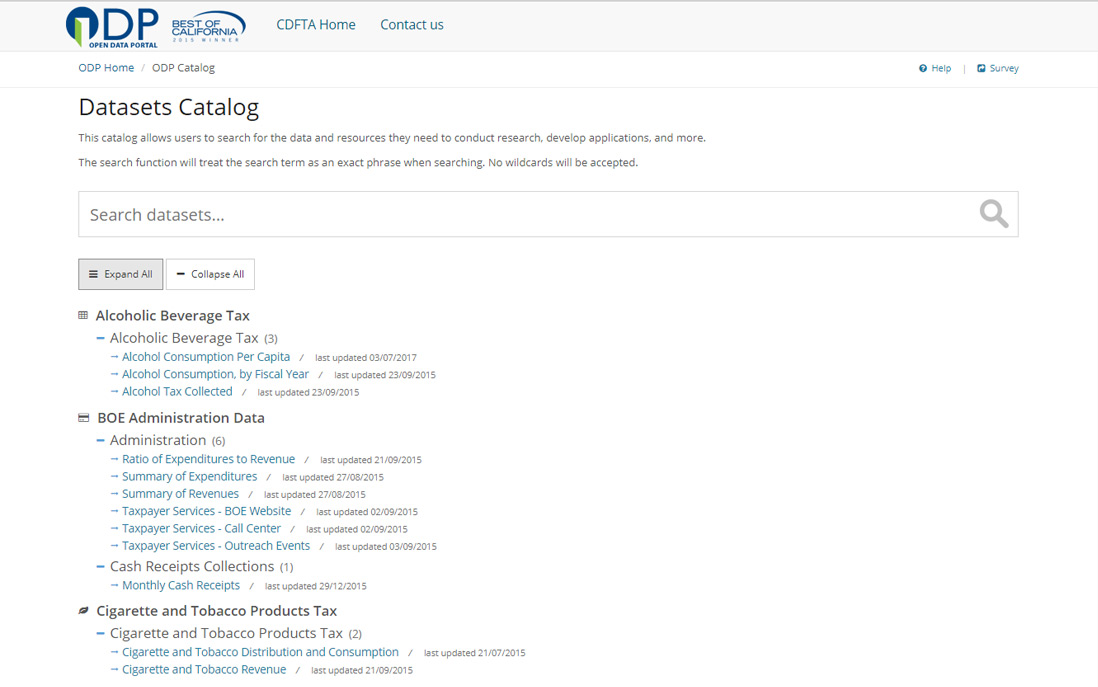
Once the user clicks on the agreement checkbox, they may use search box or click on a data category icon to display the data catalog page with data subcategories of datasets.
Inside of catalog page once the user clicks a subcategory to expand it, links to the individual datasets will be listed.
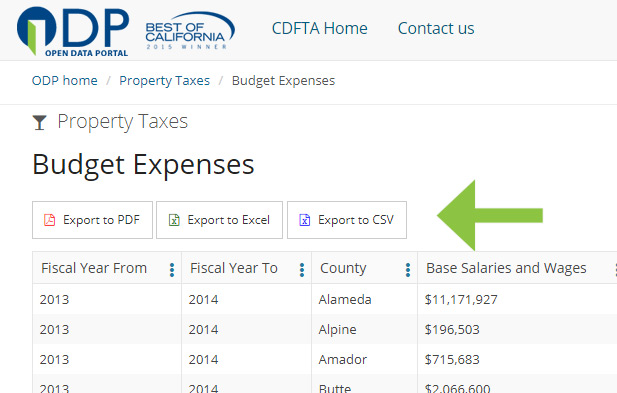
A dataset link directs the user to the data grid page where the data grid is displayed and the user has the ability to export, filter, and manage data. (More details are explained below)

The Export icons allow the user to save or open the data grid in PDF, EXCEL and CSV formats.
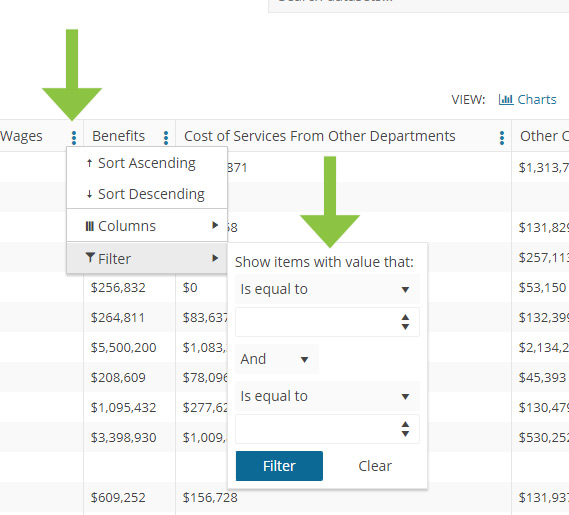
The context menu icon is placed in the header of every column. Context menu is displayed with a click of the icon. It allows the user to filter, order, and manage the grid. Some numeric data in the grid may be displayed with non-numeric characters such as commas, dollar signs, or percent signs. To execute a filter correctly, do not include these characters in your filter input values.
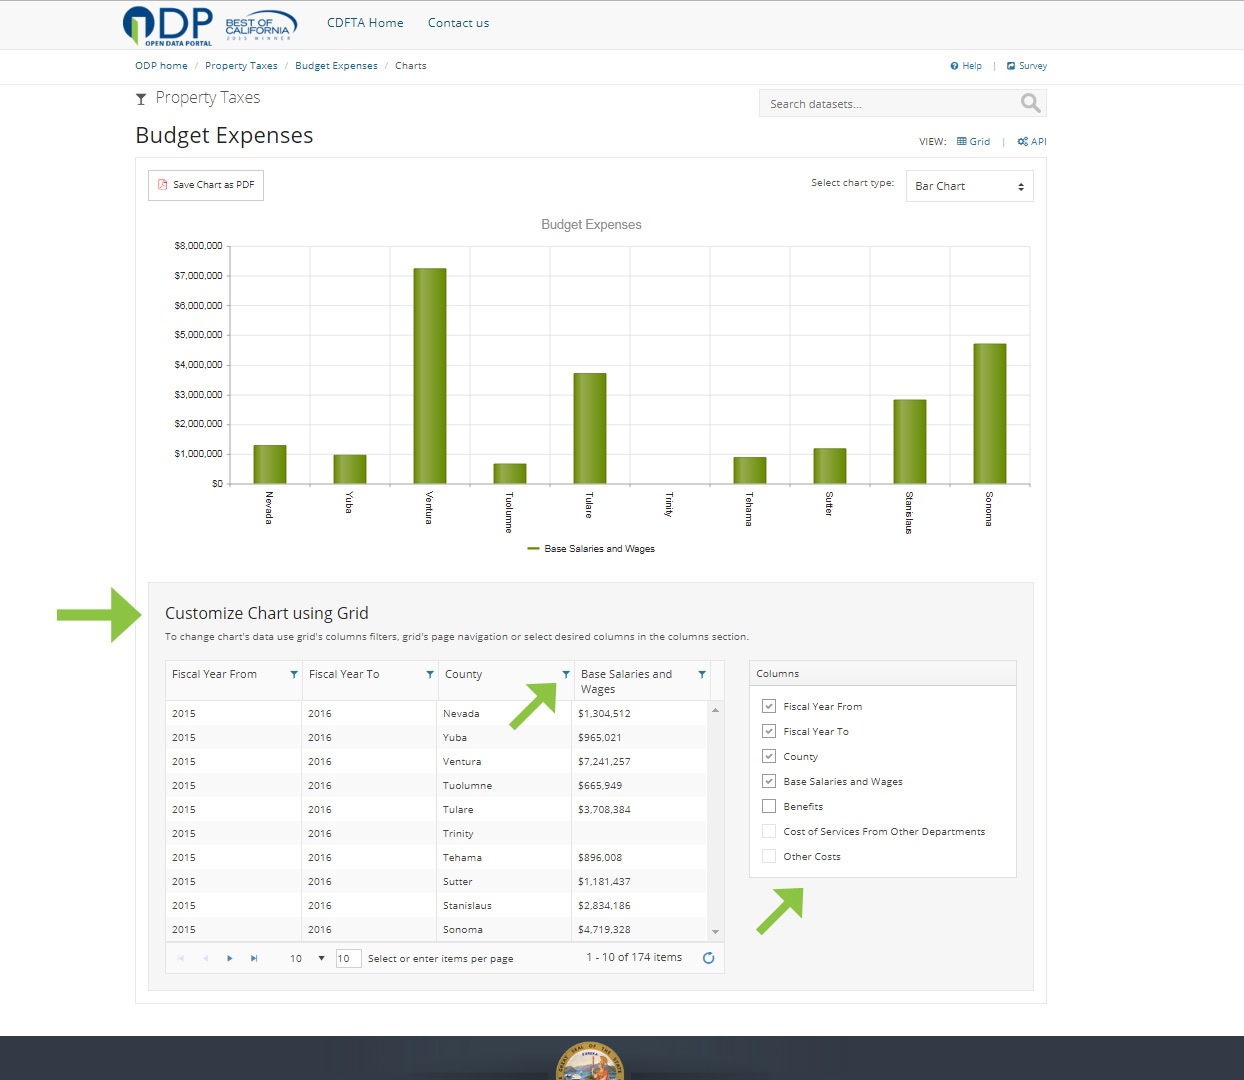
The Charts link directs the user to a charts page where data is presented graphically in bar, line, and pie charts.

Charts pages have chart type dropdown list to display bar, line, and pie chart. Each chart has customization options. Customize options allow the user to manipulate data and charts while viewing the charts. Use can use grid's filter or use show/hide column section to customize chart. The user has the ability to save the custom charts as a .pdf file.
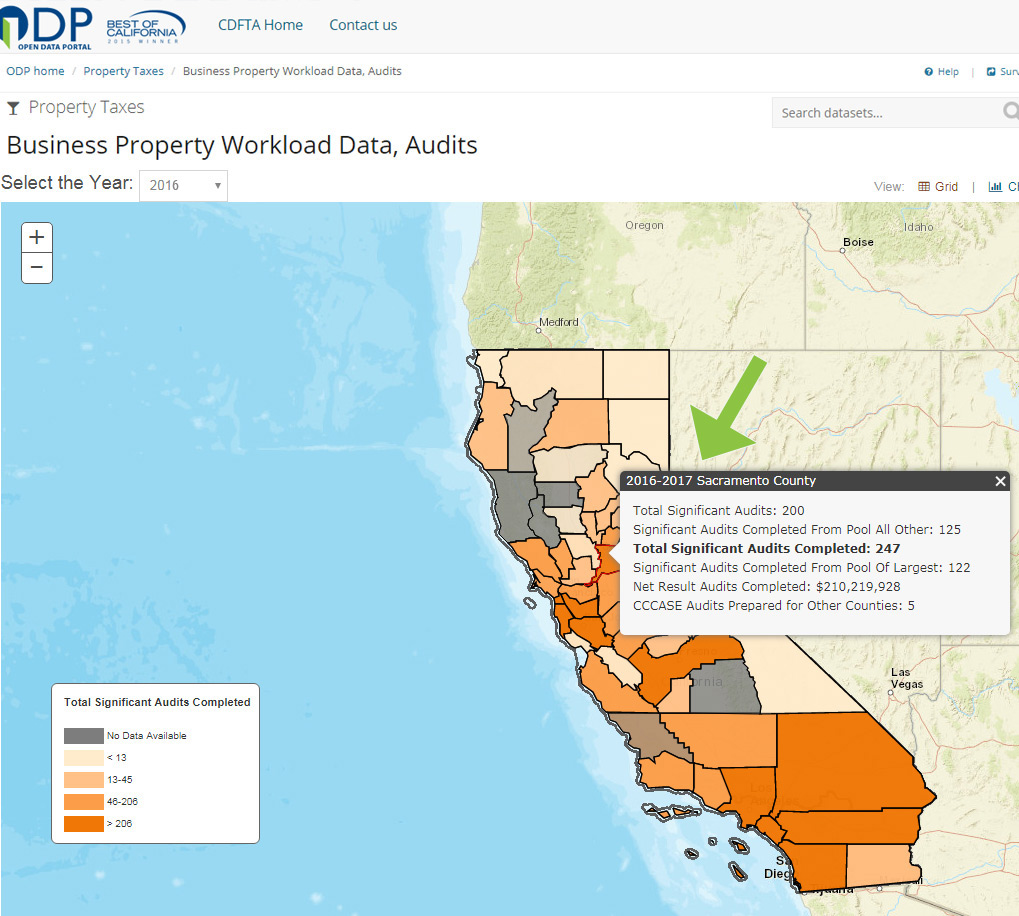
The Map link directs the user to the map page where California counties or cities are displayed and where the user can hover over those counties or cities and view the data records.

When user opens the page California map is loaded by default. in order to activate map and display the data the user needs to pick the year from the drop down menu right above the map. Then the user can hover over colored counties or cities on the map to view the data records.
API link opens up the popup window with URL strings to machine-readable code for programmatic access to the datasets.

The user can click on the ODP Home link to return to the main page. This link can be found below the Category header. The user's acceptance of the use policy lasts the entire session. Once the user closes the web page, the session is no longer active and the user will have to accept the use policy by clicking the check box if they enter ODP through a new web page/session.
